|

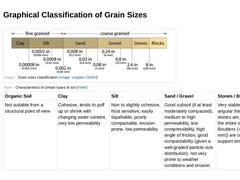
(Image: Grain sizes classification) (Table: Soil characteristics) |
|

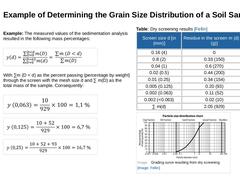
Example: The measured values of the sedimentation analysis resulted in the following mass percentages: (Formula: Aus den Messwerten der Siebanalyse folgten die Gewichtsanteile) With ∑m (D < d) as the percent passing (percentage by weight) through the screen with the mesh size d and ∑ m(D) as the total mass of the sample. Consequently: (Formula: Gewichtsanteil y(0,063)) (Formula: Gewichtsanteil y(0,125)) (Formula: Gewichtsanteil y(0,25)) |
|

|
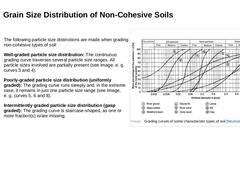
The following particle size distinctions are made when grading non-cohesive types of soil: Well-graded particle size distribution: The continuous grading curve traverses several particle size ranges. All particle sizes involved are partially present (see Image, e. g. curves 3 and 4). Poorly-graded particle size distribution (uniformly graded): The grading curve runs steeply and, in the extreme case, it remains in just one particle size range (see … |
|
|

|
|

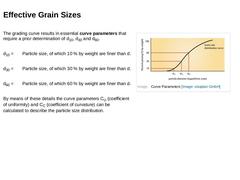
The grading curve results in essential curve parameters that require a prior determination of d10, d30 and d60. |
d10 = |
Particle size, of which 10 % by weight are finer than d. |
|
d30 = |
Particle size, of which 30 % by weight are finer than d. |
|
d60 = |
Particle size, of which 60 % by weight are finer than d. |
By means of these details the curve parameters CU (coefficient of uniformity) and CC (coefficient of curvature) can be calculated to describe the … |
|

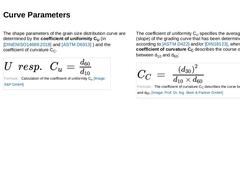
The shape parameters of the grain size distribution curve are determined by the coefficient of uniformity CU (in [DINENISO14688:2018] and [[ASTM D6913]] ) and the coefficient of curvature CC. (Formula: Calculation of the coefficient of uniformity CU) The coefficient of uniformity CU specifies the average inclination (slope) of the grading curve that has been determined according to [[ASTM D422]] and/or [DIN18123], whereas the coefficient of curvature … |
|

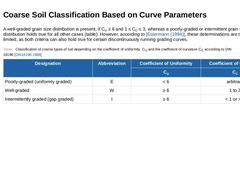
A well-graded grain size distribution is present, if CU ≥ 6 and 1 ≤ CC ≤ 3, whereas a poorly-graded or intermittent grain size distribution holds true for all other cases (table). However, according to [Estermann (1994)], these determinations are to be slightly limited, as both criteria can also hold true for certain discontinuously running grading curves. (Table: Classification of coarse types of soil depending on the coefficient of uniformity and … |
|

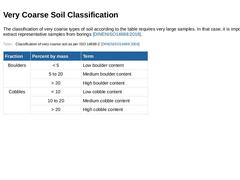
The classification of very coarse types of soil according to the table requires very large samples. In that case, it is impossible to extract representative samples from borings [DINENISO14688:2018]. (Table: Classification of very coarse soil as per ISO 14688-2) |
|

Using the grading curves and the coefficient of uniformity CU, a first essential conclusion can be derived on the compactness- or displacement capability, as well as water permeability of the soil. |
|

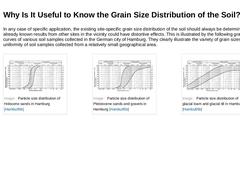
In any case of specific application, the existing site-specific grain size distribution of the soil should always be determined, using the already known results from other sites in the vicinity could have distortive effects. This is illustrated by the following grain distribution curves of various soil samples collected in the German city of Hamburg. They clearly illustrate the variety of grain sizes and soil uniformity of soil samples collected … |

|

|
|

The soil condition of coarse types of soil is characterised by the bedding density, whereas fine types of soil are characterised by their consistency.
[DINENISO14688:2018] |

|

|
|

Why is it important to know the relative density of the soil? The relative density is used to identify the arrangement of the individual grains of coarse soils to one another. With this information it is possible to draw immediate conclusions in regard to the soil stability or displacement capability, and water permeability of the soil within the excavation. |
|

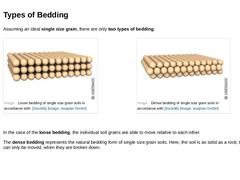
Assuming an ideal single size grain, there are only two types of bedding: |
(Image: Loose bedding of single size grain soils in accordance with [Soos96]) |
(Image: Dense bedding of single size grain soils in accordance with [Soos96]) |
In the case of the loose bedding, the individual soil grains are able to move relative to each other. The dense bedding represents the natural bedding form of single size grain soils. Here, the soil is as solid as a rock; … |
|

The term “Relative density” only applies to non-cohesive soils. Non-cohesive soil can only be loosely and imperfectly compacted under a direct static load, however the compaction can be significantly improved by means of tamping or vibration. |
|

|
|
|
|
|
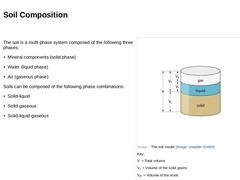
The soil is a multi-phase system composed of the following three phases: Soils can be composed of the following phase combinations: -
Solid-liquid
-
Solid-gaseous
-
Solid-liquid-gaseous
|
|
(Image: The soil model) |
|
|

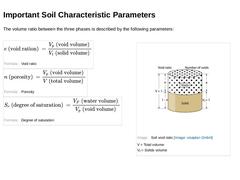
The volume ratio between the three phases is described by the following parameters: (Formula: Void ratio) (Formula: Porosity) (Formula: Degree of saturation) |
|

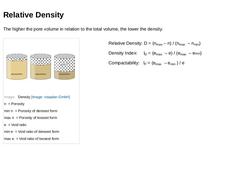
The higher the pore volume in relation to the total volume, the lower the density. (Image: Density) Relative Density: D = (nmax – n) / (nmax – nmin) Density Index: lD = (emax – e) / (emax – emin) Compactability: lF = (emax – emin ) / e |
|

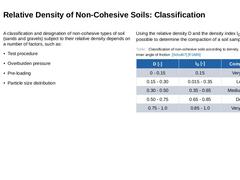
A classification and designation of non-cohesive types of soil (sands and gravels) subject to their relative density depends on a number of factors, such as: Using the relative density D and the density index lD, it is possible to determine the compaction of a soil sample. (Table: Classification of non-cohesive soils according to density, N value and inner angle of friction) |
|

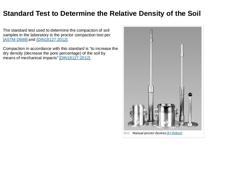
The standard test used to determine the compaction of soil samples in the laboratory is the proctor compaction test per [[ASTM D698]] and [DIN18127:2012]. Compaction in accordance with this standard is “to increase the dry density (decrease the pore percentage) of the soil by means of mechanical impacts” [DIN18127:2012]. (Image: Manual proctor devices) |
|

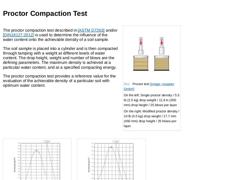
The proctor compaction test described in [[ASTM D7263]] and/or [DIN18127:2012] is used to determine the influence of the water content onto the achievable density of a soil sample. The soil sample is placed into a cylinder and is then compacted through tamping with a weight at different levels of water content. The drop height, weight and number of blows are the defining parameters. The maximum density is achieved at a particular water content, and … |

|

|
|

Cohesive soils change their state depending on the water content. When the water content is very high, these soils become liquid. When the water content decreases, they transition from a liquid to a plastic condition, then to semi-solid and finally to a solid condition. Thus, with a decreasing water content, cohesive types of soil become less mouldable, while their strength increases. The water contents at which the soil consistency is transformed … |

|

The determination of the consistency (condition) can be done both in situ and in the laboratory. In the case of the in-situ test, the condition of a cohesive type of soil is to be determined as follows: -
A type of soil is called “very soft, if it runs through the fingers while being pressed together in a fist;
-
Soft, if it can be kneaded easily;
-
Firm, if, although it is hard to be kneaded, it can be rolled out to 0.12 in (3 mm) thick rolls in the …
|